Seeing in numbers
I have always been fascinated by AI vision. How does an AI system “see”? How does it perceive the world through images?
When we think about a language model, we usually think of a model trained on a huge corpus of text, gathered from across the written world. From all that reading, it learns something simple to say and very hard to do: given the words so far, what is most likely to come next? Everything such a model knows, it first met as text.
And yet, today, you can show one a photograph and ask what it sees. AI systems also work in the other direction. Describe a scene in a sentence, and they will paint it. Give them a script, and they will voice it, set it to music, or turn it into a moving film. There are two directions here: taking the world in, and making something new from it. Both are remarkable, and this series is about the first: how a model takes in a picture.
Take a photograph of a handwritten page, and a model will read it back to you. Photograph a chart, and it will tell you what the numbers are doing. Photograph a sign in a script you cannot read, and it will tell you what the sign says.
Consider what that photograph is to a computer. It isn’t made of words. It has no vocabulary, no grammar, no first line to start reading from. It is a grid of pixels, millions of them in a typical phone photograph, and each pixel is just three numbers: how much red, how much green, how much blue. Somewhere between that grid of numbers and a sentence like “this is a page of handwriting, and the second line says…”, something happens.
Seeing feels effortless to us, because we never catch ourselves doing it. We open our eyes and the world is simply there: a face, a tree, a word painted on a wall. In 1988, the roboticist Hans Moravec1 pointed out how strange this looks from a machine’s side. As computers grew more powerful, it had turned out to be fairly easy to make them play checkers or solve problems from an intelligence test. What proved far harder were the things we can do without effort: judging depth, finding a face across a room, reaching for a cup without knocking it over.
I wanted to write about this gap between a grid of numbers and a sentence that understands it. How does a machine that learned from words come to look at a picture?
How a model sees today
Generative AI has allowed us to understand and interpret the world around us in ways that go beyond text. The word for this is multimodal. A modality is simply a kind of input: text is one, images are another, and sound and video are two more. A multimodal model can take in more than one of them and reason across all of them together.
One building block for everything
A frontier model today can read a hundred-page report, tables and charts included, and tell you what has changed since last year. It can watch a video and tell you when something happened, listen to a question spoken aloud, or look at a screenshot and work out which button to press next.
Underneath, it is still a transformer, the architecture behind every large language model. What makes it multimodal is that everything is converted into the same building block:
- Text is broken into tokens, small pieces of words.
- Images are divided into patches, small squares of pixels, and each patch becomes a token too.
- Every token is then turned into an embedding: a long list of numbers that places it at a point in a vast space of meaning, where similar things sit close together.
Once a word and a patch of a photograph live in the same space, the transformer’s attention mechanism can connect them. Attention lets every token look at every other token and decide what matters. The word “umbrella” in your question finds the red patches in your photograph.
From sliding windows to patches
It wasn’t always done this way. For most of the last decade, machines saw through convolutional neural networks, or CNNs2. A CNN looks at an image through a sliding window. A small grid of numbers, called a filter or kernel, moves across the picture a few pixels at a time, like a magnifying glass passed over a page. At every stop it asks one small question: is there an edge here? A curve? A patch of green? Stack enough of these layers and the answers build on one another. Edges become textures, textures become shapes, and shapes become scenery.
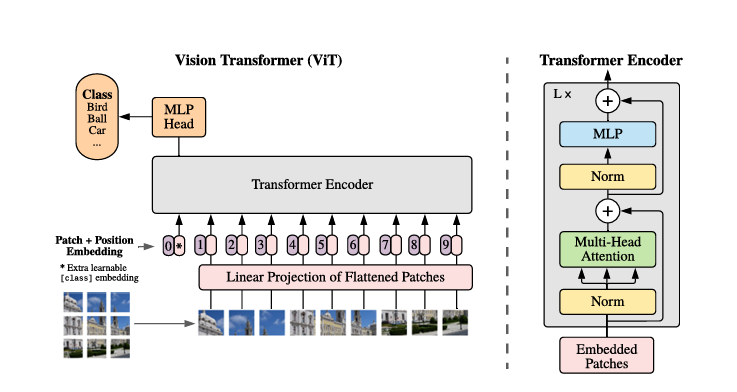
In 2020 came the Vision Transformer3, which did something bolder. It divided the whole image into patches, sixteen pixels by sixteen in the original paper, and read them the way a language model reads words. Every patch could attend to every other patch from the very first layer.
The figure from the paper tells the story on its own. The right half is the encoder from Attention Is All You Need4, the 2017 paper that introduced the Transformer for translating between languages, redrawn almost unchanged. What is new is at the bottom: the photograph divided into patches, each one numbered so the model knows its place. Now let’s look at the top left. The model’s answer is a single word from a fixed list: bird, ball, car. How that small box became a sentence is what this series is about.

The Vision Transformer. Figure 1 from Dosovitskiy et al., “An Image is Worth 16x16 Words” (ICLR 2021). The encoder on the right is drawn after Vaswani et al. (2017).
Ideas in this field rarely disappear, though. Many of today’s vision models have brought the window back. They attend within small local windows to save effort, and step back to take in the whole picture only now and then5.
What seeing involves
So what does “seeing” actually involve? Imagine showing a model a photograph of a busy street market.
- Reading the hand-painted sign above the tea stall is OCR, optical character recognition.
- Finding every bicycle and drawing a box around each one is object detection.
- Pointing to “the woman in the green dress” and answering with her exact position in pixels is grounding: tying words to places in the picture.
- Tracing the outline of an umbrella so precisely that every pixel is marked as umbrella or not-umbrella is segmentation.
- Knowing that the dog is asleep under the cart, not on it, is spatial understanding.
- Telling that the bus is further away than the tea stall is depth estimation.
We perceive depth with two eyes, each seeing a slightly different view, and the brain compares them; this is called stereo vision. A model looking at one flat photograph has to learn depth the way a painter does: from perspective, from the size of familiar things, from the way shadows fall. Give it a sequence of frames and add time, and the same model can follow the bicycle as it weaves through the crowd.
Quietly, at scale
When we talk about AI today, we often picture a chatbot, or software that writes code. Much more of it runs quietly underneath the world:
- Document understanding, which pairs OCR with layout analysis and retrieval, reads contracts, engineering drawings and scanned archives by the million.
- Satellites read the health of a field in near-infrared light.
- On forest trails, Google’s SpeciesNet6 recognises nearly 2,500 categories of animal in photographs.
- Self-driving cars combine cameras, lidar and radar into one picture of the road; this is called sensor fusion.
- Each time we speak to a phone, speech recognition turns our voice into text, and text-to-speech turns the answer back into a voice.
When I think of how AI has become an integral part of our lives, though, three scenarios come to mind. They are the areas where I have found its role most remarkable: what is possible today that was not possible even a few years ago, and, more importantly, what could become possible next.
Three explorations
A page from Chhanda
Rabindranath Tagore (Thakur, in Bengali) is known to most of the world as a poet, composer and playwright. In 1913 he became the first non-European to receive the Nobel Prize in Literature. In India, he is remembered as far more: a guiding light of Indian thought and culture across the nineteenth and twentieth centuries, a leading voice of India’s freedom movement, and a philosopher whose songs became the national anthems of India and Bangladesh.
In his lifetime, he composed more than two thousand songs, founded Visva-Bharati University at Santiniketan, and wrote novels, plays and stories that are still celebrated today. Late in life, in his sixties, he began to paint, and went on to make thousands of paintings and drawings. But art had always been part of his writing, as the margins of his manuscripts show: crossed-out words were joined into flowing shapes, until the corrections became drawings of their own.
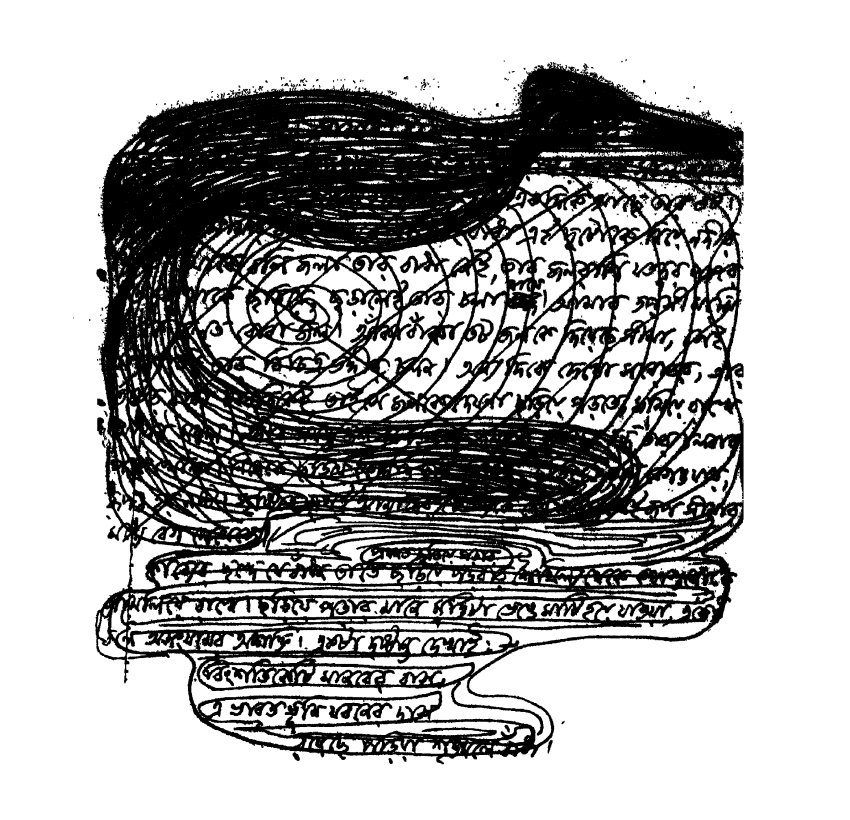
A working page from Rabindranath Tagore’s Chhanda, reproduced as the book’s frontispiece.
What you are looking at is a working page. The script is Bengali, written by hand from left to right. Most of it is Tagore’s prose: his reasoning about metre, the counted beats that give a line of verse its pulse, drafted for Chhanda, his book on the rhythms of Bengali poetry (chhanda means metre, or rhythm).
In his corrections, Tagore let the pen keep moving. The earlier thoughts at the top disappear under a dark wave of ink, which rolls in from the left and crests on the right. Across the middle of the page he drew concentric rings, spreading over the words like ripples from a stone dropped in water.
At the bottom, a few lines are treated differently. Each one is held inside a flowing outline rather than blotted out, as if set apart to be analysed. They come from a poem by the nineteenth-century Bengali poet Hemchandra Bandyopadhyay. Just above them, Tagore writes: let me show an example.
The example is about rhythm. In the book, Tagore explains that a metre of two beats walks steadily, while a metre of three, being odd, never quite settles. Set in three beats, Hemchandra’s words jostle and push against one another, which suited the poem. Rewritten in an even measure, however, the same words walk calmly. The page seems to hold both states at once: the surge above, and the lines held still below.
And the rings? The printed chapter speaks of metre in the language of orbits, and the draft itself talks of rhythm spreading out. A metre, like the rhythmic cycles of Indian music, always returns to where it began. Perhaps that is what he was drawing. He would caution us, though. Tagore asked that his pictures be valued for their rhythm of form, not read as illustrations of an idea.
When I shared a photograph of this page with an AI model, this is what happened.
- It read part of the handwriting, including some of the lines half-buried under the ink, and the small instruction above the verse: let me show an example.
- It recognised the lines at the bottom as Hemchandra’s.
- It searched the web in Bengali and found the printed chapter where the example appears.
- It set the draft beside the print, and noticed that they disagree. In the draft, Tagore calls the three-beat metre the weakness of unrestraint. In the book, the view softens into the momentum of instability.
- It followed the poem out of the book and into Tagore’s life. His memoir remembers the poem as a longing for freedom, heard like birdsong at dawn. In his novel Gora, a boy recites it, and Tagore writes the scene with gentle irony.
All of this took only a few minutes.
None of it was one thing. The photograph was divided into patches, as in the figure above, and an image encoder turned ink into the same building block as words. A language model that had read a great deal of Bengali recognised the script, and the cadence of a nineteenth-century poem.
But the eye alone could make out only part of what lay under the ink. The rest came from a loop. The model looked, decided it needed the printed book, searched for it, read what came back, compared it with what it had seen, and looked again. This is what people mean when they call an AI system an agent: a model that can decide what it needs, use a tool to get it, and carry on. Behind each step of that loop sits something large and quiet:
- a search index covering much of the written web;
- a printed chapter that someone, somewhere, had typed or scanned and put online;
- data centres running the model;
- the engineering that lets a single conversation hold a manuscript, a printed chapter and a memoir side by side.
A few years ago, each of these was a separate field. Here they worked as one, on a page of ink.
A robot learns to reach
Near the start of this post, Moravec’s list of things that are effortless for us and hard for a machine ended with reaching for a cup without knocking it over. For most of the history of robotics, that was the hard part. An industrial robot could weld a car door to a fraction of a millimetre, but only because the door was always in exactly the same place. A robot knew precisely where things were, and nothing at all about what they were.
Now imagine asking a robot arm to pick up something it could use as a hammer. There are a few ordinary objects on the table in front of it, and one of them is a rock. Nothing in its training was ever labelled “hammer”. Its practice came from 13 robots over 17 months, collecting demonstrations in an office kitchen. It knew how to pick things up and put them down. No one had ever told it what a hammer is for, or that a rock might do.
In 2023, a team at Google DeepMind asked their model, RT-27, to do exactly this. It picked up the rock.
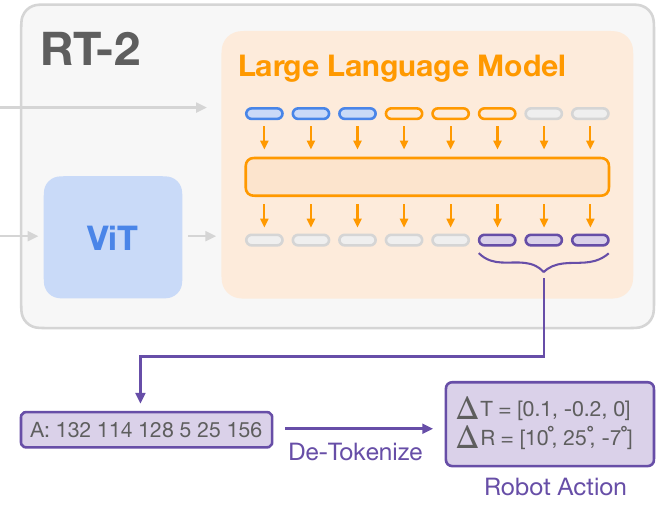
The architecture of RT-2, from Figure 1 of Brohan et al. (2023). An instruction and a camera image enter from the left; the model answers in tokens, which become a movement.
The instruction and the camera image enter from the left. The small blue box is the Vision Transformer from earlier in this post, now just one part of a larger machine. It turns the camera image into tokens, and those join the words of the instruction inside the language model. The model answers the way language models always do, with tokens. But these tokens are numbers, and the numbers are a movement.
That is the idea at the heart of RT-2: a movement, written as a sentence. Every step of the arm is described by eight numbers:
stop   Δx   Δy   Δz   Δroll  Δpitch  Δyaw  gripper
  0   132  114  128     5     25    156     200
- The first number says whether the task is finished.
- The next three move the hand: forward or back, left or right, up or down.
- The three after that turn it.
- The last one opens or closes the gripper.
Each number is one of 256 evenly spaced steps across what the arm can do, so 128, the middle step, means stay still. You can see it in the figure: the 128 in the third place becomes a zero.
When I read the paper, the detail that stayed with me was a small one. One version of the model had no tokens set aside for numbers. So the team took the 256 words the model used least often, and gave each of them a new meaning: one step of movement. The rarest words the model knew became its words for motion.
The model was then trained on two things at once: images from the web with questions and answers about them, and the robot’s own demonstrations from the kitchen. What came out is in the paper’s examples:
- Asked for an improvised hammer, it chose the rock.
- Asked for a drink for someone who is tired, it chose the energy drink.
- Told to move a banana to the sum of two plus one, it placed it by the number three.
- It followed an instruction given in Spanish.
The authors are careful about what this means. The robot’s physical skills stayed within what it had practised in that kitchen. What the web gave it were new ways to use them.
As with Tagore’s writing, the interesting part is what had to come together:
- knowledge gathered from across the web;
- a Vision Transformer to see;
- a language model taught to speak in movements;
- 17 months of demonstrations.
And the machinery underneath is just as large and just as quiet. The biggest version of RT-2, at 55 billion parameters, was far too large to run on the robot itself. It ran on a cluster of processors in a data centre, and the robot asked it over the network what to do next, one to three times a second. The arm was in a kitchen; its judgement was in a data centre.
About a year later, the same kind of model was folding laundry8.
With the image from Chhanda, the model synthesised the data, and the interpretation, the meaning, was left to me. Here there is no one between seeing and doing. A few times every second, the machine has to act on its own understanding of the world.
The unseen and the unread
The last exploration turns away from what a machine can do, and towards what none of us has seen yet.
The skies beyond
For thirty-five years, the Hubble Space Telescope has been sending back pictures of the sky, and they are all kept in an archive. Cut into small squares around each object it has recorded, the archive holds nearly 100 million images, each only a few dozen pixels across. Somewhere in there are things that don’t fit: galaxies caught in the middle of colliding, galaxies trailing streams of gas like jellyfish, and gravitational lenses, where the gravity of one galaxy bends the light of another celestial object behind it into an arc. Astronomers are very good at spotting these by eye. But no one could look at a hundred million pictures in a reasonable timeframe.
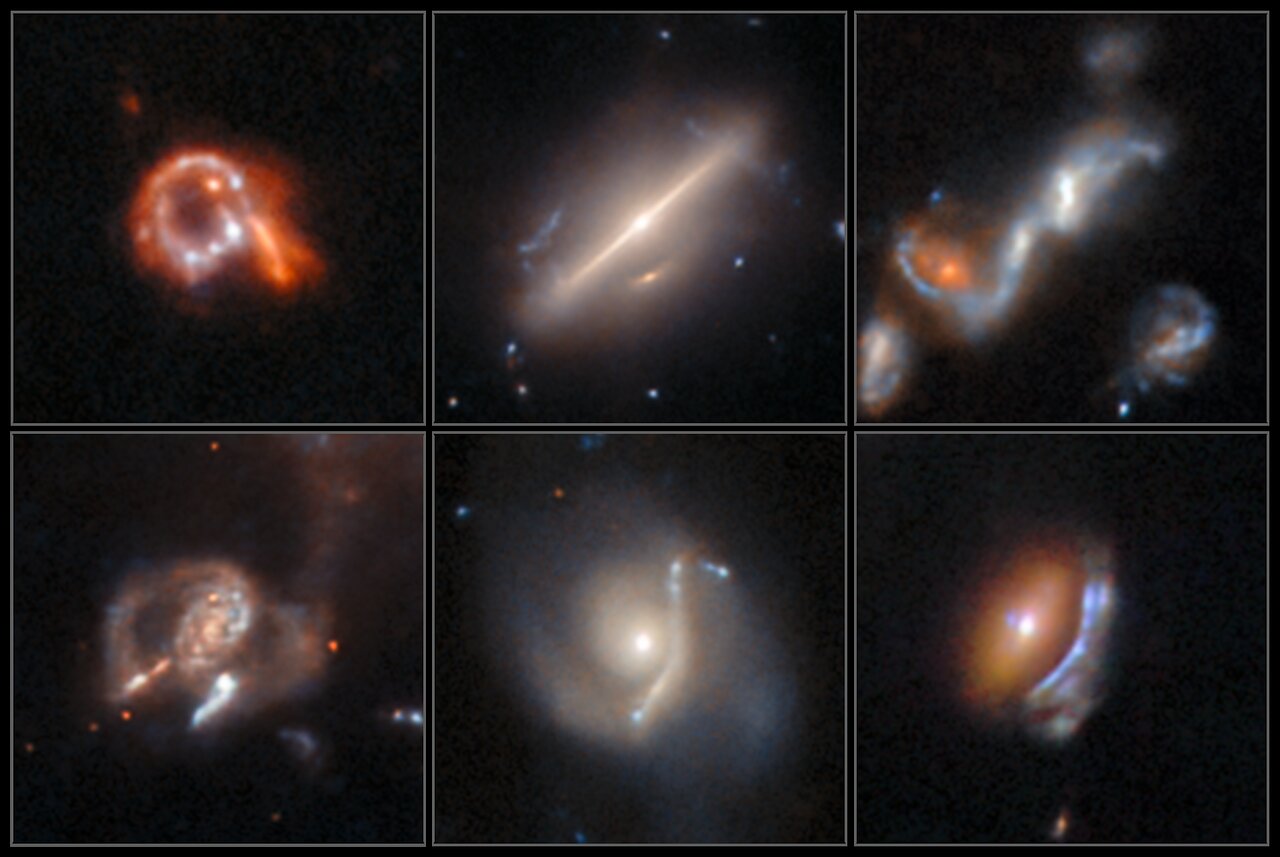
Anomalies found in Hubble’s archive with the help of AI. Credit: ESA/Hubble & NASA, D. O’Ryan, P. Gómez (European Space Agency), M. Zamani (ESA/Hubble). CC BY 4.0.
In 2025, two researchers at the European Space Agency, David O’Ryan and Pablo Gómez, set a model to look for them. It is called AnomalyMatch9. It learns from a handful of examples and a great deal of unlabelled data. It also keeps asking a person which of its guesses are interesting, and learns from the answers; this is called active learning. It was tested on galaxies from Galaxy Zoo10, where every image had been judged by at least forty volunteers, and counted as “odd” only when nine in ten of them agreed. It did about as well as an established tool built for the same job.
Then it was set loose on the whole archive:
- In two and a half days, it had gone through all of it. It was the first time anyone had searched the archive systematically for anomalies.
- The two researchers then sat down and looked at every one of the roughly 1,400 objects it flagged. More than 1,300 were real anomalies, and more than 800 had never been described in the scientific literature.
- Several dozen objects fit no category at all.
The machine found what didn’t fit. Naming it is still our work.
The same partnership runs at a larger scale in the Euclid mission. Launched by ESA in 2023, Euclid11 is mapping about a third of the sky and sending back around 100 gigabytes of data every day. Here’s how its first catalogue of lenses was built:
- Five models scanned more than a million galaxies in its first release. The best of them was Zoobot12, a model first trained to classify galaxy shapes from the judgements of Galaxy Zoo volunteers.
- The most promising candidates went to people. About 1,800 volunteers on a platform called Space Warps13 searched the 78,000 most promising galaxies.
- Experts vetted and modelled the results.
The outcome was 497 strong-lens candidates14, which doubled the number known from space-based imaging.
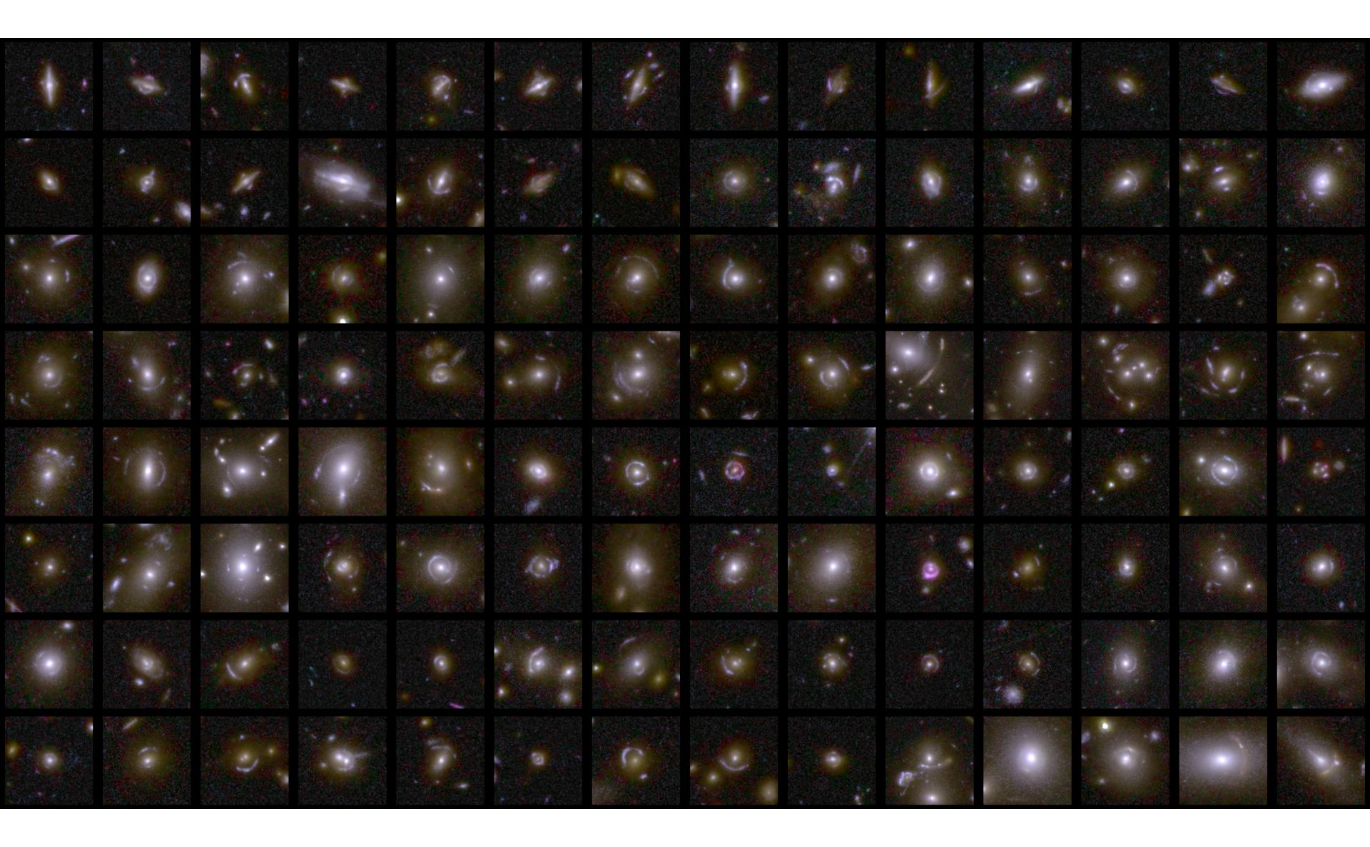
Strong gravitational lenses found in Euclid’s first data. Credit: ESA/Euclid/Euclid Consortium/NASA, image processing by M. Walmsley, M. Huertas-Company, J.-C. Cuillandre. CC BY-SA 3.0 IGO.
For the next release, 72 million galaxies are ready, and machine learning has picked out 300,000 promising images for the public to inspect. By the end of the mission, Euclid should find around 100,000 of these lenses, about a hundred times more than are known today. If you’d like to be one of the people looking, Space Warps is open to anyone on Zooniverse.
Much more is happening at the edges:
- ASTERIS15 is a transformer that combines eight exposures of the same patch of sky. Applied to deep images from the James Webb Space Telescope, it found three times as many candidate galaxies from the early universe as before. Its authors then checked carefully, with fake galaxies hidden in real data, that it was not imagining them.
- The Vera C. Rubin Observatory16 in Chile issued 800,000 alerts on the first night of its alert stream in February 2026, each one a change somewhere in the sky. It will soon send up to seven million a night, and software sorts them before any person sees them.
- AION-117 combines 39 kinds of astronomical data, images and spectra among them, using a separate tokenizer for each and one transformer over all of them. It is the same architecture described at the start of this post, pointed at the sky.
As with the earlier scenarios, the interesting part is what comes together. Telescopes kept the pictures for decades. Volunteers taught a model what a galaxy looks like. The model chose what the volunteers should look at next, and their answers trained the model after it. Experts made the final call. The crowd teaches the machine, and the machine points the crowd.
Some things are hard to see because they are faint, far away, or buried among a hundred million others. Others we can see perfectly well, and still cannot read.
The dawn of civilisation
Four and a half thousand years ago, along the Indus River and its neighbours, stood some of the largest cities of the ancient world. Harappa and Mohenjo-daro had streets laid out on a grid, covered drains and public wells, and weights so standardised that the same measures were used across the whole region. The civilisation flourished from about 2600 to 1900 BCE, in the age of the pyramids in Egypt and the first cities of Mesopotamia. Then its great cities were slowly abandoned, and it was forgotten for nearly four thousand years, until archaeologists began excavations at Harappa and Mohenjo-daro in the early 1920s.
Its people left behind thousands of small carved seals, most of them about the size of a postage stamp. Each has a short line of signs along the top and, usually, an animal below, most often a bull with a single horn. Pressed into clay, the seals seem to have marked goods and sealed containers, and some travelled as far as Mesopotamia.
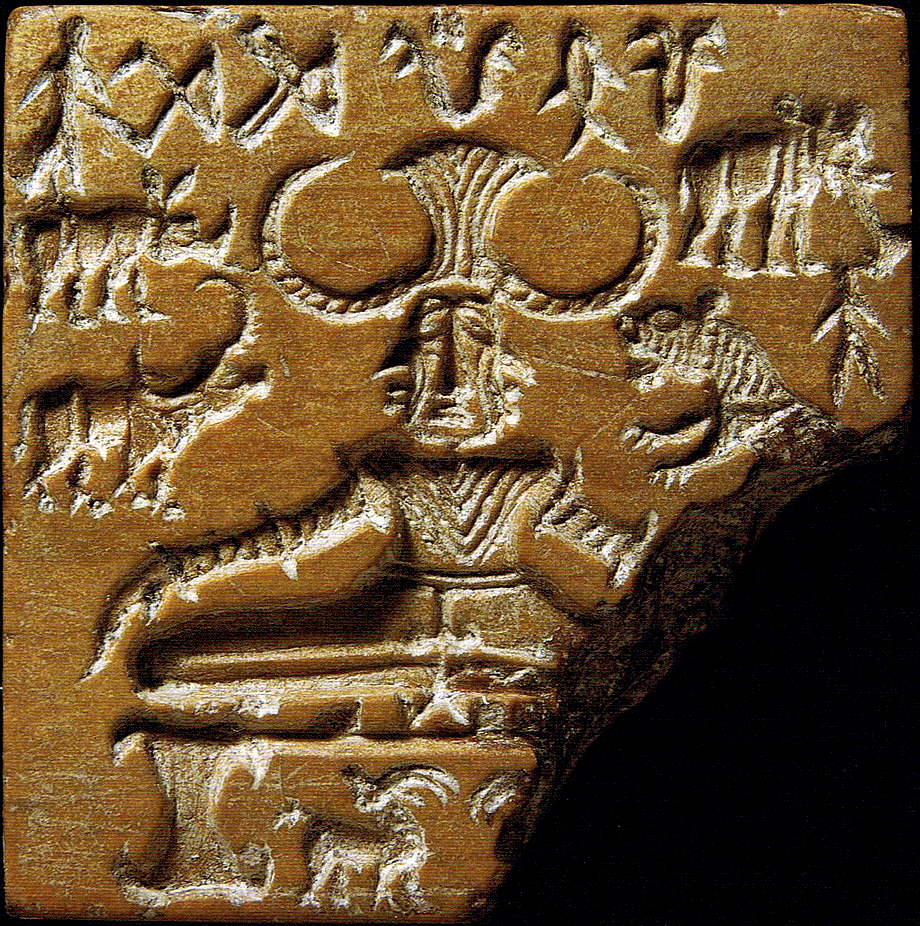
The Pashupati seal, Mohenjo-daro, c. 2350–2000 BCE.
This is one of the most famous. It was found at Mohenjo-daro in 1928–29, and it is about three and a half centimetres across. At its centre sits a figure wearing a great horned headdress, with an elephant, a tiger, a rhinoceros and a buffalo around it, and two deer beneath its seat. Seven signs run along the top.
The name it goes by is our own. In 1931 the archaeologist John Marshall saw in the figure an early form of the god Shiva as Pashupati, lord of the animals, and the name stayed. Scholars have debated that reading ever since: how many faces the figure has, what kind of horns it wears, whether it is a god at all. The seal could tell us itself who is sitting there. The answer is in the line of signs above, and no one alive can read it.
It isn’t for want of trying. The Indus script has been studied for a century, by archaeologists, linguists, mathematicians and, more recently, computers. But it offers almost nothing to hold on to:
- The inscriptions are tiny. The average one is about five signs long, and none is longer than thirty.
- There are around four hundred different signs, far too many for an alphabet.
- No one knows what language they wrote.
- No bilingual has ever been found: no Indus Rosetta Stone, with the same words written beside a script we can read.
The eye is not the problem. Machines can already do a great deal here: with every inscription transcribed, a computer can show which signs begin a text, which end it, and which pairs recur. One sign, drawn like a jar, is the most common in the whole script, and it ends most of the lines it appears in. Patterns like this are real, and anyone can check them. What they mean is another question.
Compare this with a story from this year. In 79 AD, the eruption of Vesuvius buried the Roman town of Herculaneum, and with it a library of papyrus scrolls, turned to charcoal by the heat. Opening one destroys it. So researchers scanned the scrolls with X-rays at a particle accelerator, and trained models to find the faint traces of ink inside the rolled layers. Volunteers from around the world joined them through an open prize. Part of the progress in making that ink detection work across different scrolls came from a swarm of autonomous AI agents, inspired by an open-source project of Andrej Karpathy’s. In June 2026, one of these scrolls was read from beginning to end without ever being opened.
At Herculaneum, the barrier was the eye. The scrolls are in Greek and Latin, languages scholars read well, so once a machine could see the ink, people could read the words. The project’s leader said as much: the next steps belong to scholars who can read and understand the text.
At Harappa it is the other way round. We can see every sign on this seal, sharp and clear, in a photograph anyone can find. What is missing is not an eye but a key. Computers have deciphered lost scripts before, in experiments, but only with a related language that we can read to guide them: Greek for Linear B, Hebrew for Ugaritic. For the Indus script, no such relative has been found.
As with the image of Tagore’s writing, the robot and the sky, the interesting part is what comes together. At Herculaneum: a particle accelerator, a model trained to see ink, volunteers, agents, and scholars who read Greek. At Harappa, every piece is in place except one: someone who can read it.
The seal has been seen. It has not yet been read.
Back to the grid
We began with a grid of numbers, and a question: how does a machine that learned from words come to look at a picture?
Along the way, the same pieces kept appearing. An image divided into patches. Patches turned into the same building block as words. A transformer that lets every piece look at every other. And each time, something large around the model: a search index, a data centre, an archive kept for decades, volunteers and experts.
Each time, too, the last step was held by someone different. With the page from Chhanda, the model gathered what it could, and the meaning was left to me. The robot had no one between seeing and doing. In the sky, the machine found what didn’t fit, and people named it. At Harappa, the machine can see every sign, and no one yet can read them.
None of this is magic, and none of it needs to stay a black box. Each piece has a history, a reason, and often a few lines of code that anyone can run. That is what this series is for: to take the pieces one at a time, from the grid of numbers to the sentence, so that a student, an engineer, or anyone curious can see how it works, and where it stops.
In the posts that follow, we’ll go back to the small box in the corner of the Vision Transformer’s figure, the one that could only answer bird, ball or car, and follow how it became a sentence: how an eye is joined to a language model, and what a multimodal model looks like today, in a single picture.
Citations
Hans Moravec (1988). Mind Children: The Future of Robot and Human Intelligence. Harvard University Press. ↩︎
Alex Krizhevsky, Ilya Sutskever and Geoffrey E. Hinton (2012). ImageNet Classification with Deep Convolutional Neural Networks. NeurIPS 2012. https://papers.nips.cc/paper/2012/hash/c399862d3b9d6b76c8436e924a68c45b-Abstract.html ↩︎
Alexey Dosovitskiy et al. (2021). An Image is Worth 16x16 Words: Transformers for Image Recognition at Scale. ICLR 2021. https://arxiv.org/abs/2010.11929 ↩︎
Ashish Vaswani et al. (2017). Attention Is All You Need. NeurIPS 2017. https://arxiv.org/abs/1706.03762 ↩︎
Qwen Team, Alibaba Group (2025). Qwen2.5-VL Technical Report. https://arxiv.org/abs/2502.13923 ↩︎
Google Research. Where wild things roam: Identifying wildlife with SpeciesNet. https://research.google/blog/where-wild-things-roam-identifying-wildlife-with-speciesnet/ — code: https://github.com/google/cameratrapai ↩︎
Anthony Brohan et al. (2023). RT-2: Vision-Language-Action Models Transfer Web Knowledge to Robotic Control. CoRL 2023. https://arxiv.org/abs/2307.15818 — overview on the Google DeepMind blog: https://deepmind.google/discover/blog/rt-2-new-model-translates-vision-and-language-into-action/ ↩︎
Kevin Black et al. (2024). π0: A Vision-Language-Action Flow Model for General Robot Control. Physical Intelligence. https://arxiv.org/abs/2410.24164 — with videos: https://www.pi.website/blog/pi0 ↩︎
ESA (2026). 1400 quirky objects found in Hubble’s archive. https://www.esa.int/Science_Exploration/Space_Science/1400_quirky_objects_found_in_Hubble_s_archive — paper: David O’Ryan and Pablo Gómez (2025). Identifying astrophysical anomalies in 99.6 million source cutouts from the Hubble Legacy Archive using AnomalyMatch. A&A 704, A227. https://www.aanda.org/articles/aa/full_html/2025/12/aa55512-25/aa55512-25.html ↩︎
Galaxy Zoo, on Zooniverse. https://www.zooniverse.org/projects/zookeeper/galaxy-zoo ↩︎
Max Planck Institute for Extraterrestrial Physics (2026). 10,000 Euclid lenses wanted: MPE call for Space Warps. https://www.mpe.mpg.de/8197472/news20260421 ↩︎
Mike Walmsley et al. Zoobot: deep learning models for galaxy morphology. https://zoobot.readthedocs.io ↩︎
Space Warps – ESA Euclid, on Zooniverse. https://www.zooniverse.org/projects/aprajita/space-warps-esa-euclid ↩︎
Euclid Collaboration: M. Walmsley et al. (2025). Euclid Quick Data Release (Q1): The Strong Lensing Discovery Engine A – System overview and lens catalogue. https://arxiv.org/abs/2503.15324 ↩︎
Yuduo Guo et al. (2026). Deeper detection limits in astronomical imaging using self-supervised spatiotemporal denoising. Science. https://arxiv.org/abs/2602.17205 ↩︎
NSF–DOE Vera C. Rubin Observatory (2026). Rubin Observatory Launches Real-Time Discovery Machine for Monitoring the Night Sky. https://rubinobservatory.org/news/first-alerts ↩︎
Liam Parker et al. (2025). AION-1: Omnimodal Foundation Model for Astronomical Sciences. NeurIPS 2025. https://arxiv.org/abs/2510.17960 ↩︎